AWS : CloudWatch configuration on Windows instance with Systems Manager Run Command
We can configure our Amazon EC2 instances to send Windows Server's logs, events, and performance counters to Amazon CloudWatch Logs and Amazon CloudWatch Events.
Amazon EC2 offers several methods for configuring our instances to export this data. The method we choose will depend, in part, on the version of Windows Server we are running and the version of the configuration agent running on our instance. It will also depend on whether we want to manually configure our instances to use a local configuration file or remotely configure them using Systems Manager Run Command or Systems Manager State Manager.
Amazon EC2 instances use an agent to send log data to CloudWatch. With Windows Server 2008 to Windows Server 2012 R2, the agent is either the EC2Config service or SSM Agent. With Windows Server 2016, the agent is SSM Agent.
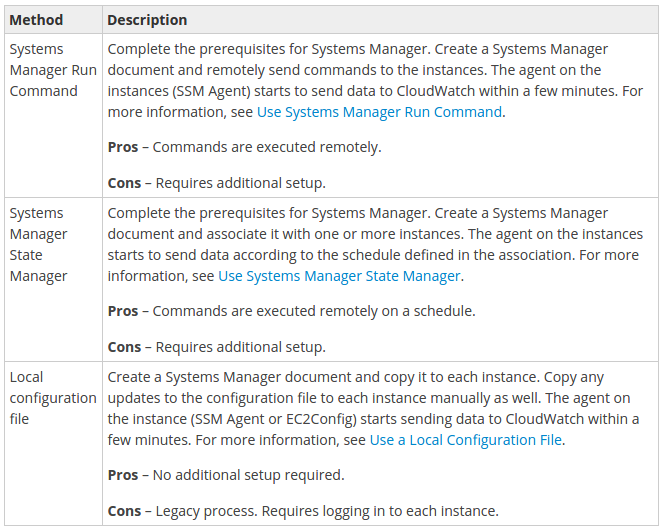
The following table describes the methods available to integrate with CloudWatch.
The following table (from Sending Logs, Events, and Performance Counters to Amazon CloudWatch) describes the methods available to integrate with CloudWatch.
The following sample file (AWS.EC2.Windows.CloudWatch.json) should be downloaded on our computer:
{
    "IsEnabled": false,
    "EngineConfiguration": {
        "PollInterval": "00:00:15",
        "Components": [
            {
                "Id": "ApplicationEventLog",
                "FullName": "AWS.EC2.Windows.CloudWatch.EventLog.EventLogInputComponent,AWS.EC2.Windows.CloudWatch",
                "Parameters": {
                    "LogName": "Application",
                    "Levels": "1"
                }
            },
            {
                "Id": "SystemEventLog",
                "FullName": "AWS.EC2.Windows.CloudWatch.EventLog.EventLogInputComponent,AWS.EC2.Windows.CloudWatch",
                "Parameters": {
                    "LogName": "System",
                    "Levels": "7"
                }
            },
            {
                "Id": "SecurityEventLog",
                "FullName": "AWS.EC2.Windows.CloudWatch.EventLog.EventLogInputComponent,AWS.EC2.Windows.CloudWatch",
                "Parameters": {
                "LogName": "Security",
                "Levels": "7"
                }
            },
            {
                "Id": "ETW",
                "FullName": "AWS.EC2.Windows.CloudWatch.EventLog.EventLogInputComponent,AWS.EC2.Windows.CloudWatch",
                "Parameters": {
                    "LogName": "Microsoft-Windows-WinINet/Analytic",
                    "Levels": "7"
                }
            },
            {
                "Id": "IISLogs",
                "FullName": "AWS.EC2.Windows.CloudWatch.CustomLog.CustomLogInputComponent,AWS.EC2.Windows.CloudWatch",
                "Parameters": {
                    "LogDirectoryPath": "C:\\inetpub\\logs\\LogFiles\\W3SVC1",
                    "TimestampFormat": "yyyy-MM-dd HH:mm:ss",
                    "Encoding": "UTF-8",
                    "Filter": "",
                    "CultureName": "en-US",
                    "TimeZoneKind": "UTC",
                    "LineCount": "3"
                }
            },
            {
                "Id": "CustomLogs",
                "FullName": "AWS.EC2.Windows.CloudWatch.CustomLog.CustomLogInputComponent,AWS.EC2.Windows.CloudWatch",
                "Parameters": {
                    "LogDirectoryPath": "C:\\CustomLogs\\",
                    "TimestampFormat": "MM/dd/yyyy HH:mm:ss",
                    "Encoding": "UTF-8",
                    "Filter": "",
                    "CultureName": "en-US",
                    "TimeZoneKind": "Local"
                }
            },
            {
                "Id": "PerformanceCounter",
                "FullName": "AWS.EC2.Windows.CloudWatch.PerformanceCounterComponent.PerformanceCounterInputComponent,AWS.EC2.Windows.CloudWatch",
                "Parameters": {
                    "CategoryName": "Memory",
                    "CounterName": "Available MBytes",
                    "InstanceName": "",
                    "MetricName": "Memory",
                    "Unit": "Megabytes",
                    "DimensionName": "",
                    "DimensionValue": ""
                }
            },
            {
                "Id": "CloudWatchLogs",
                "FullName": "AWS.EC2.Windows.CloudWatch.CloudWatchLogsOutput,AWS.EC2.Windows.CloudWatch",
                "Parameters": {
                    "AccessKey": "",
                    "SecretKey": "",
                    "Region": "us-east-1",
                    "LogGroup": "Default-Log-Group",
                    "LogStream": "{instance_id}"
                }
            },
            {
                "Id": "CloudWatch",
                "FullName": "AWS.EC2.Windows.CloudWatch.CloudWatch.CloudWatchOutputComponent,AWS.EC2.Windows.CloudWatch",
                "Parameters":
                {
                    "AccessKey": "",
                    "SecretKey": "",
                    "Region": "us-east-1",
                    "NameSpace": "Windows/Default"
                }
            }
        ],
        "Flows": {
            "Flows":
            [
                "(ApplicationEventLog,SystemEventLog),CloudWatchLogs",
                "PerformanceCounter,CloudWatch"
            ]
        }
    }
}
Configure the JSON File for CloudWatch:
We determine which logs, events, and performance counters are sent to CloudWatch by specifying our choices in a configuration file. The process of creating this file and specifying our choices can take 30 minutes or more to complete. After we have completed this task once, we can reuse the configuration file on all of our instances.
Here are the steps:
By specifying credentials, a region, and a metric namespace for CloudWatch, we enable an instance to send performance counter data to CloudWatch. If we don't want to send performance counter data, we can skip this procedure. If we want to send the same performance counter data to different locations, we can add additional sections with unique IDs (for example, "CloudWatch2" and CloudWatch3") and a different region for each ID.
To configure settings to send performance counter data to CloudWatch:
- In the JSON file, locate the CloudWatch section near the bottom of the file.
- (Optional) If we are using a local configuration file with local credentials, type our access key ID for AccessKey and our secret access key for SecretKey.
Note: If we use Systems Manager Run Command or State Manager, do not provide credentials in the configuration file, as there is a chance that they could be exposed in log files, including debug log files. We'll configure credentials using an IAM role.
-
For Region, type the region where we want to send log data (for example us-east-1). Although we can send performance counters to a different region from where we send our log data, setting this parameter to the same region is recommended where our instance is running.
- For NameSpace, type the metric namespace where performance counter data will be written.
{
    "Id": "CloudWatch",
    "FullName": "AWS.EC2.Windows.CloudWatch.CloudWatch.CloudWatchOutputComponent,AWS.EC2.Windows.CloudWatch",
    "Parameters": {
        "AccessKey": "",
        "SecretKey": "",
        "Region": "us-east-1",
        "NameSpace": "Windows/Default"
    }
},
Configure settings to send log data to CloudWatch Logs
Next, specify credentials, region, log group name, and a log stream namespace. This enables the instance to send log data to CloudWatch Logs. If we want to send the same log data to different locations, we can add additional sections with unique IDs (for example, "CloudWatchLogs2" and CloudWatchLogs3") and a different region for each ID.
-
{
    "Id": "CloudWatchLogs",
    "FullName": "AWS.EC2.Windows.CloudWatch.CloudWatchLogsOutput,AWS.EC2.Windows.CloudWatch",
    "Parameters": {
        "AccessKey": "",
        "SecretKey": "",
        "Region": "us-east-1",
        "LogGroup": "Default-Log-Group",
        "LogStream": "{instance_id}"
    }
},
-
(Optional) If we are using a local configuration file with local credentials, type our access key ID for AccessKey and our secret access key for SecretKey.
Note: If we use Systems Manager Run Command or State Manager, do not provide credentials in the configuration file, as there is a chance that they could be exposed in log files, including debug log files. You'll configure credentials using an IAM role.
For Region, type the region where we want to send log data (for example, us-east-1).
-
For LogGroup, type the name for our log group. This name will appear on the Log Groups screen in the CloudWatch console.
-
For LogStream, type the destination log stream. This name will appear on the Log Groups > Streams screen in the CloudWatch console.
If we use {instance_id}, the default, the log stream name is the instance ID of this instance.
If we specify a log stream name that doesn't already exist, CloudWatch Logs automatically creates it for you. We can define a log stream name using a literal string, the predefined variables {instance_id}, {hostname}, and {ip_address}, or a combination of these.
We can send performance counters, event log data, Event Tracing for Windows (ETW) data, and other log data to Amazon CloudWatch Logs and Amazon CloudWatch Events.
To configure the performance counters to send to CloudWatch
-
Locate the PerformanceCounter section.
{ "Id": "PerformanceCounter", "FullName": "AWS.EC2.Windows.CloudWatch.PerformanceCounterComponent.PerformanceCounterInputComponent,AWS.EC2.Windows.CloudWatch", "Parameters": { "CategoryName": "Memory", "CounterName": "Available MBytes", "InstanceName": "", "MetricName": "AvailableMemory", "Unit": "Megabytes", "DimensionName": "", "DimensionValue": "" } }, -
We can select any performance counters that are available in Performance Monitor. We can select different categories to upload to CloudWatch as metrics, such as .NET CLR Data, ASP.NET Applications, HTTP Service, Memory, or Process and Processors.
For each performance counter, copy the PerformanceCounter section and change the Id parameter to make it unique (for example, "PerformanceCounter2"). Update the other parameters as necessary.
-
For CategoryName, type the performance counter category. To find the available categories and counters, do the following:
- Open Performance Monitor.
- Choose Monitoring Tools, and then choose Performance Monitor.
- In the results pane, choose the green + (plus) button. The categories and counters are listed in the Add Counters dialog box.
- For CounterName, type the name of the performance counter.
- For InstanceName, type values from the Add Counters dialog box in Performance Monitor, which can be one of the following:
- Blank, if the selected object has no instances.
- A single instance of the selected object.
- _Total to use the aggregate of all instances.
- For MetricName, type the CloudWatch metric that you want performance data to appear under.
For Unit, type the appropriate unit of measure for the metric. The possible values are as follows:
Seconds | Microseconds | Milliseconds | Bytes | Kilobytes | Megabytes | Gigabytes | Terabytes | Bits | Kilobits | Megabits | Gigabits | Terabits | Percent | Count | Bytes/Second | Kilobytes/Second | Megabytes/Second | Gigabytes/Second | Terabytes/Second | Bits/Second | Kilobits/Second | Megabits/Second | Gigabits/Second | Terabits/Second | Count/Second | None.- (Optional) Type a dimension name and value for DimensionName and DimensionValue to specify a dimension for our metric. These parameters provide another view when listing metrics. We can also use the same dimension for multiple metrics so that we can view all metrics belonging to a specific dimension.
To send system event log data to CloudWatch Logs
- In the JSON file, locate the SystemEventLog section.
{ "Id": "SystemEventLog", "FullName": "AWS.EC2.Windows.CloudWatch.EventLog.EventLogInputComponent,AWS.EC2.Windows.CloudWatch", "Parameters": { "LogName": "System", "Levels": "7" } }, - For Levels, specify the type of messages to upload. We can specify one of the following values:
- 1 - Upload only error messages.
- 2 - Upload only warning messages.
- 4 - Upload only information messages.
Each data type must have a corresponding destination in the Flows section.
For example, to send a performance counter defined in the PerformanceCounter section to the destination defined in the CloudWatch section, add PerformanceCounter,CloudWatch to the Flows section. Similarly, to send the custom log, ETW log, and system log to CloudWatch Logs, add (CustomLogs,ETW,SystemEventLog),CloudWatchLogs.
Note that we can send the same performance counter or log file to more than one destination. For example, to send the application log to two different destinations that we defined in the CloudWatchLogs section, add ApplicationEventLog,(CloudWatchLogs,CloudWatchLogs2) to the Flows section.
To configure flow control
-
In the AWS.EC2.Windows.CloudWatch.json file, locate the Flows section.
"Flows": { "Flows": [ "PerformanceCounter,CloudWatch", "(PerformanceCounter,PerformanceCounter2), CloudWatch2", "(CustomLogs, ETW, SystemEventLog),CloudWatchLogs", "CustomLogs, CloudWatchLogs2", "ApplicationEventLog,(CloudWatchLogs, CloudWatchLogs2)" ] } - For Flows, add each data type that to be uploaded (for example, ApplicationEventLog) and its destination (for example, CloudWatchLogs).
AWS (Amazon Web Services)
- AWS : EKS (Elastic Container Service for Kubernetes)
- AWS : Creating a snapshot (cloning an image)
- AWS : Attaching Amazon EBS volume to an instance
- AWS : Adding swap space to an attached volume via mkswap and swapon
- AWS : Creating an EC2 instance and attaching Amazon EBS volume to the instance using Python boto module with User data
- AWS : Creating an instance to a new region by copying an AMI
- AWS : S3 (Simple Storage Service) 1
- AWS : S3 (Simple Storage Service) 2 - Creating and Deleting a Bucket
- AWS : S3 (Simple Storage Service) 3 - Bucket Versioning
- AWS : S3 (Simple Storage Service) 4 - Uploading a large file
- AWS : S3 (Simple Storage Service) 5 - Uploading folders/files recursively
- AWS : S3 (Simple Storage Service) 6 - Bucket Policy for File/Folder View/Download
- AWS : S3 (Simple Storage Service) 7 - How to Copy or Move Objects from one region to another
- AWS : S3 (Simple Storage Service) 8 - Archiving S3 Data to Glacier
- AWS : Creating a CloudFront distribution with an Amazon S3 origin
- AWS : Creating VPC with CloudFormation
- AWS : WAF (Web Application Firewall) with preconfigured CloudFormation template and Web ACL for CloudFront distribution
- AWS : CloudWatch & Logs with Lambda Function / S3
- AWS : Lambda Serverless Computing with EC2, CloudWatch Alarm, SNS
- AWS : Lambda and SNS - cross account
- AWS : CLI (Command Line Interface)
- AWS : CLI (ECS with ALB & autoscaling)
- AWS : ECS with cloudformation and json task definition
- AWS Application Load Balancer (ALB) and ECS with Flask app
- AWS : Load Balancing with HAProxy (High Availability Proxy)
- AWS : VirtualBox on EC2
- AWS : NTP setup on EC2
- AWS: jq with AWS
- AWS & OpenSSL : Creating / Installing a Server SSL Certificate
- AWS : OpenVPN Access Server 2 Install
- AWS : VPC (Virtual Private Cloud) 1 - netmask, subnets, default gateway, and CIDR
- AWS : VPC (Virtual Private Cloud) 2 - VPC Wizard
- AWS : VPC (Virtual Private Cloud) 3 - VPC Wizard with NAT
- DevOps / Sys Admin Q & A (VI) - AWS VPC setup (public/private subnets with NAT)
- AWS - OpenVPN Protocols : PPTP, L2TP/IPsec, and OpenVPN
- AWS : Autoscaling group (ASG)
- AWS : Setting up Autoscaling Alarms and Notifications via CLI and Cloudformation
- AWS : Adding a SSH User Account on Linux Instance
- AWS : Windows Servers - Remote Desktop Connections using RDP
- AWS : Scheduled stopping and starting an instance - python & cron
- AWS : Detecting stopped instance and sending an alert email using Mandrill smtp
- AWS : Elastic Beanstalk with NodeJS
- AWS : Elastic Beanstalk Inplace/Rolling Blue/Green Deploy
- AWS : Identity and Access Management (IAM) Roles for Amazon EC2
- AWS : Identity and Access Management (IAM) Policies, sts AssumeRole, and delegate access across AWS accounts
- AWS : Identity and Access Management (IAM) sts assume role via aws cli2
- AWS : Creating IAM Roles and associating them with EC2 Instances in CloudFormation
- AWS Identity and Access Management (IAM) Roles, SSO(Single Sign On), SAML(Security Assertion Markup Language), IdP(identity provider), STS(Security Token Service), and ADFS(Active Directory Federation Services)
- AWS : Amazon Route 53
- AWS : Amazon Route 53 - DNS (Domain Name Server) setup
- AWS : Amazon Route 53 - subdomain setup and virtual host on Nginx
- AWS Amazon Route 53 : Private Hosted Zone
- AWS : SNS (Simple Notification Service) example with ELB and CloudWatch
- AWS : Lambda with AWS CloudTrail
- AWS : SQS (Simple Queue Service) with NodeJS and AWS SDK
- AWS : Redshift data warehouse
- AWS : CloudFormation
- AWS : CloudFormation Bootstrap UserData/Metadata
- AWS : CloudFormation - Creating an ASG with rolling update
- AWS : Cloudformation Cross-stack reference
- AWS : OpsWorks
- AWS : Network Load Balancer (NLB) with Autoscaling group (ASG)
- AWS CodeDeploy : Deploy an Application from GitHub
- AWS EC2 Container Service (ECS)
- AWS EC2 Container Service (ECS) II
- AWS Hello World Lambda Function
- AWS Lambda Function Q & A
- AWS Node.js Lambda Function & API Gateway
- AWS API Gateway endpoint invoking Lambda function
- AWS API Gateway invoking Lambda function with Terraform
- AWS API Gateway invoking Lambda function with Terraform - Lambda Container
- Amazon Kinesis Streams
- AWS: Kinesis Data Firehose with Lambda and ElasticSearch
- Amazon DynamoDB
- Amazon DynamoDB with Lambda and CloudWatch
- Loading DynamoDB stream to AWS Elasticsearch service with Lambda
- Amazon ML (Machine Learning)
- Simple Systems Manager (SSM)
- AWS : RDS Connecting to a DB Instance Running the SQL Server Database Engine
- AWS : RDS Importing and Exporting SQL Server Data
- AWS : RDS PostgreSQL & pgAdmin III
- AWS : RDS PostgreSQL 2 - Creating/Deleting a Table
- AWS : MySQL Replication : Master-slave
- AWS : MySQL backup & restore
- AWS RDS : Cross-Region Read Replicas for MySQL and Snapshots for PostgreSQL
- AWS : Restoring Postgres on EC2 instance from S3 backup
- AWS : Q & A
- AWS : Security
- AWS : Security groups vs. network ACLs
- AWS : Scaling-Up
- AWS : Networking
- AWS : Single Sign-on (SSO) with Okta
- AWS : JIT (Just-in-Time) with Okta
Ph.D. / Golden Gate Ave, San Francisco / Seoul National Univ / Carnegie Mellon / UC Berkeley / DevOps / Deep Learning / Visualization